

PROJECT MONITORING

Sometimes what you really need is to be able to view your project with snapshots in time. Once we have designed a flight to capture what you need for your project we can execute it with precision any time, and as many times, as your project requires. We can provide you layers of time that can demonstrate exactly what impact your work has done.
Sequenced Project IMAGING
Let us begin by saying that we are not here to tell what is best for your project. When it comes to analysis you are undoubtedly the expert. However, there is only so much ground you can cover when there are never enough hours in the day. To start we can help by covering more than 100 acres for every 30 minutes in the air with an image resolution of about an inch per pixel! But, we can offer far more than just a high resolution image. We want to help you leverage the power of multi-spectral sensor imaging to gain new insight and focus your hard work. Our analysis is based on far more than the eye can see. The standard red, green, and blue of normal vision can only perceive so much. Our sensors perceive both the red-edge and near-infrared bands of the electromagnetic spectrum. Why is that important? The health of your project can be qualified in the amount of light from these bands that plants absorb and reflect. Additionally, our sensors use radiometric calibration paired with an on board daylight sensor to guarantee that every report can be reliably compared for an “apples to apples” comparison. Finally, on the day of your flight all data will be processed on site and delivered to you in clear, visual, easy to understand reports for real-time decision making.
So what CAN we deliver?
Scroll down to see just some of what a report offers!
Real-Time Orthomosaic:
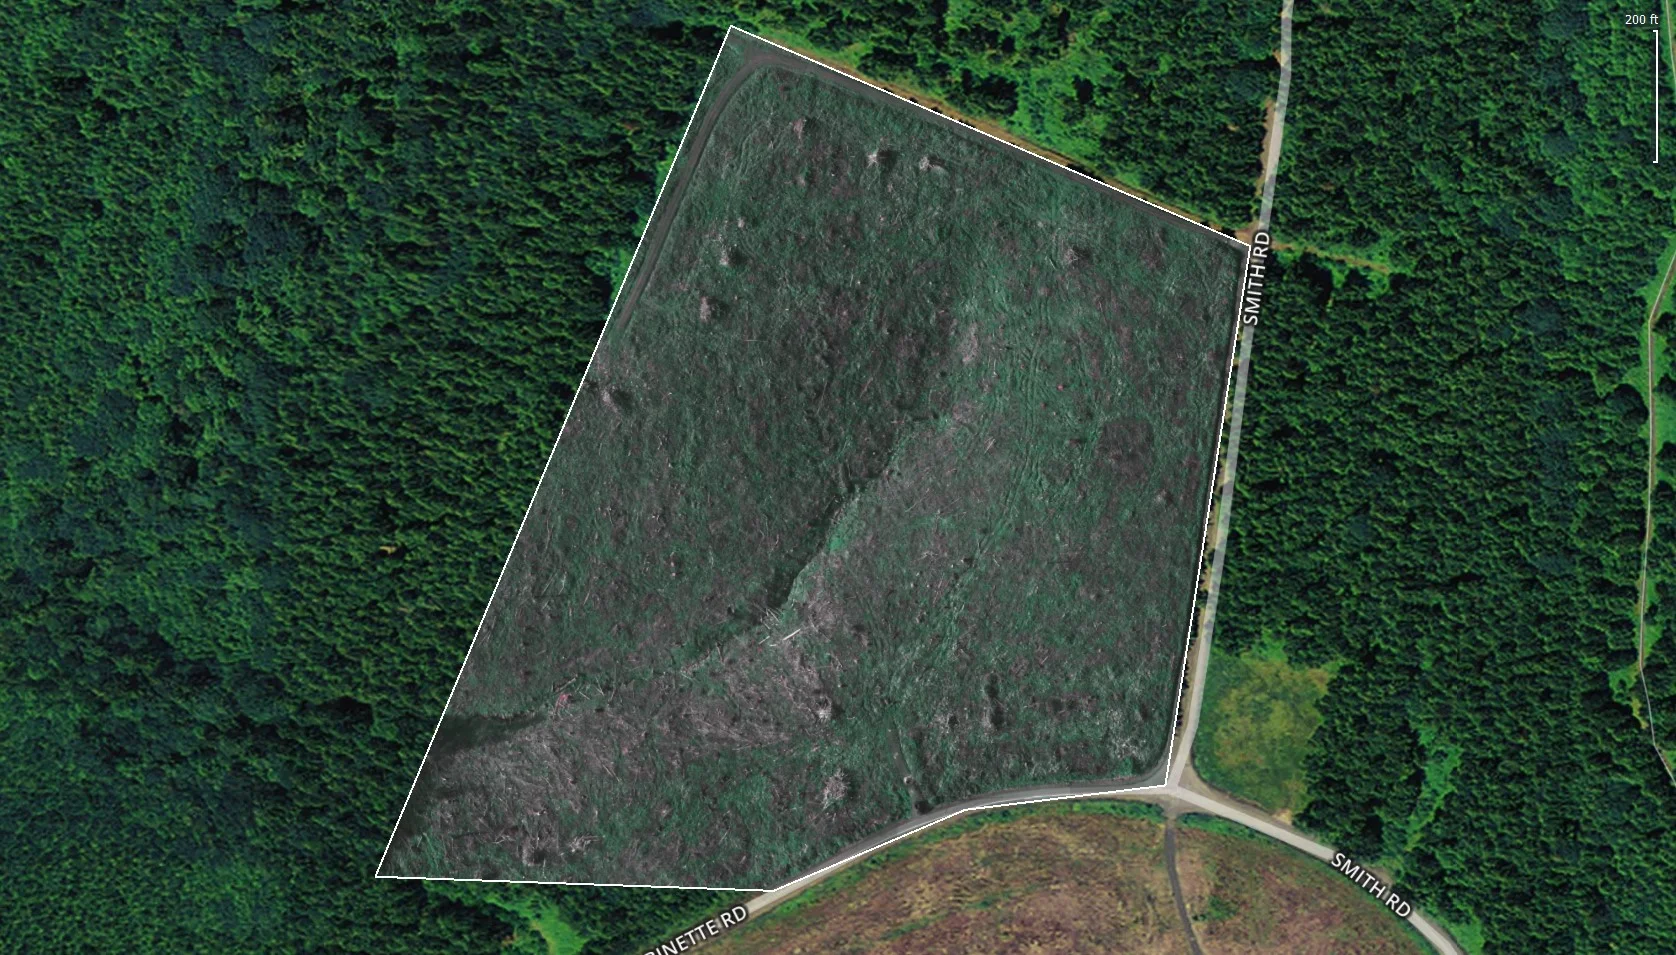
Begin changing your perspective with a single high resolution image of your area of interest. Far more detailed than any satellite image can offer and data that isn’t twelve to twenty-four months past its usefulness.
DTM:

From the subtle to significant the Digital Terrain Model can help you in visually understanding topographical changes. Forest to field, the vineyard to the orchard, understanding terrain assists in managing exposure to light, wind, and the flow of surface water and irrigation.
Normalized Difference Vegetation Index (NDVI):

Example of a boundary NDVI Report with an orthographic comparison.
Normalized Difference Vegetation Index or NDVI report is the foundation of plant health analysis. This has far reaching possibilities in areas such as agriculture, forestry, and ecosystem management. This report utilizes that data captured from the near infrared and red bands of light. The chlorophyll in healthy plants reflect more of the near infrared light while absorbing the light from the blue and red wavelengths. When plants begin to stress the ratio of absorbed and reflected light shifts and can be detected and mapped to show you right where your attention is needed. Minimize your time and maximize the value of your inputs.